YouTube channel analytics by @handle, with Viducia’s verdict

Type any public channel’s @handle and ViduciaStudio reads it, with no sign-in: growth, how each video did against the channel’s median, what works, and how competitors compare. Then Viducia’s verdict tells you what holds the channel back and what to make next.

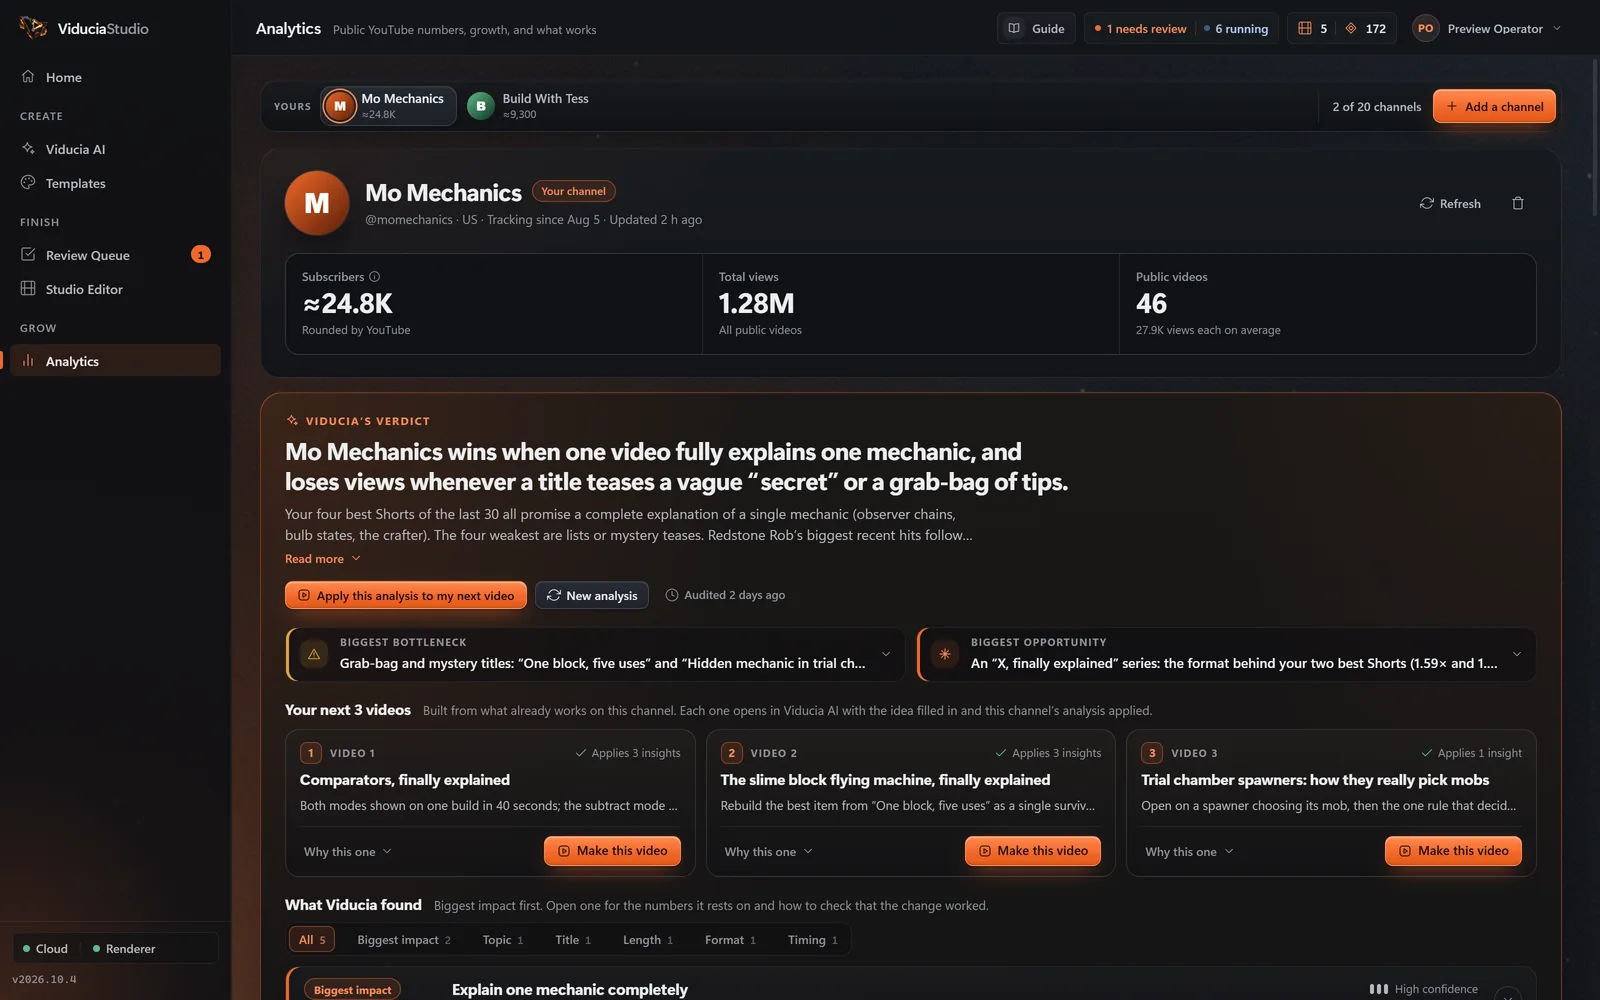
The Analytics screen in ViduciaStudio for the sample channel Mo Mechanics: subscribers, total views and public videos, then Viducia’s verdict with the biggest bottleneck, the biggest opportunity and three suggested next videos.
The Analytics screen in the Windows app, showing the sample channel @momechanics.

Any public channel, by @handle

Add your own channel or a competitor with its @handle or channel link. Nothing to connect and no YouTube sign-in: it reads only what YouTube shows the public.

Add a channel
As “My channel” or “A competitor”, by @handle or link
Channels you can follow
8 on Starter, 20 on Creator, 40 on Studio
Growth
Subscriber and view charts from 28 days to all time, with daily gains, from the day tracking starts
Data kept
Public statistics are refreshed or deleted within 30 days, as YouTube’s API rules require
Cost
Reading and tracking channels is part of every plan. Only Viducia’s verdict uses tokens.
Without a plan
A free account follows one channel of its own, and Viducia audits it free once every 3 days

Overview and growth

The numbers that describe a channel at a glance, each with a plain definition. Sample channel @momechanics

Median views per video
46.1K Last 30 public videos The views of a typical recent video: half do better, half worse. Calculated by ViduciaStudio.
Uploads a week
2.6 Steady for 8 weeks Public uploads per week over the last 8 weeks.
Engagement rate
5.4% Likes and comments per 100 views Likes and comments as a share of views. Calculated by ViduciaStudio.
Views gained, last 28 days
+184K +22% vs the 28 days before Total views added across all public videos, from daily readings.
Subscribers gained, last 28 days
≈ +1.9K Rounded by YouTube YouTube rounds public subscriber counts, so small changes may not appear.
Videos beating 2× median
3 of 30 10% of recent videos Recent videos with at least twice the channel’s median views.

YouTube rounds public subscriber counts, so they are shown with ≈.

Every video against the median

The median is the views of a typical recent video: half do better, half worse. Each video is shown as a multiple of it, so one viral hit never skews the picture. The Videos table also sorts by views per day, engagement and the first 24 hours.

Videos made in ViduciaStudio carry a “Made with ViduciaStudio” badge, so you can see how they compare.

Sample channel @momechanics: the last 8 uploads, median 46.1K views
  1. The piston door secret nobody uses Made with ViduciaStudio Views: 18.5K Against the median: 0.40×
  2. The crafter trick that saves hours Views: 66.1K Against the median: 1.4×
  3. Every bulb state explained Made with ViduciaStudio Views: 69.7K Against the median: 1.5×
  4. Observer chains, finally explained Views: 73.4K Against the median: 1.6×
  5. Hidden mechanic in trial chambers Made with ViduciaStudio Views: 15.2K Against the median: 0.33×
  6. One block, five uses Views: 12.5K Against the median: 0.27×
  7. How I plan big builds Views: 16.2K Against the median: 0.35×
  8. Testing viewer contraptions Made with ViduciaStudio Views: 70.7K Against the median: 1.5×

What works

Patterns by length, publishing day and time, title style and upload rhythm, once a channel has about ten public videos. Each one says how many videos it rests on.

Best-performing length
30–45 s · 1.6× the median of other lengths
Best day to publish
Thursday · 1.4× the median of other days
Titles phrased as a claim
1.7× views · vs titles phrased as a question
Shorts vs long-form
Shorts get 3.1× the views · Median Short 26K · median long-form 8.4K
Longest gap between uploads
9 days · Views dipped 18% after it

Sample channel @momechanics.

Competitors

Follow the channels you measure yourself against. Competitors are benchmarks only: the same public numbers, side by side.

Sample benchmark: @momechanics against @redstonerob
Public number@momechanics@redstonerob
Subscribers≈ 24.8K≈ 61.2K
Median views per video46.1K41K
Uploads a week2.63.4
Engagement rate5.4%4.7%

Viducia’s verdict

An AI channel audit that shows its evidence. Every number it uses is checked against the channel’s real data, and stock advice is rejected. An audit uses 25 edit tokens, and you approve the price before it runs.

Sample channel@momechanics, audited from its last 30 public videos

Mo Mechanics wins when one video fully explains one mechanic, and loses views whenever a title teases a vague “secret” or a grab-bag of tips.

Biggest bottleneck

Grab-bag and mystery titles: “One block, five uses” and “Hidden mechanic in trial chambers” got 0.27× and 0.33× your median, and they make up a third of the last 30 uploads.

Biggest opportunity

An “X, finally explained” series: the format behind your two best Shorts (1.59× and 1.51× median), kept to 30–45 seconds and published on Thursdays.

What commenters say, word for word

Recurring themes from the comments, with the viewers’ own words.

  • “can you share the world file?”
    Requests for world downloads
  • “does this work on bedrock?”
    Version questions
  • “now do comparators pls”
    Comparators confuse people

Your next 3 videos

Built from what already works on the channel. In the app, each one opens in Viducia AI with the idea filled in and the analysis applied.

  1. Comparators, finally explained

    Both modes shown on one build in 40 seconds; the subtract mode is the moment it clicks.

  2. The slime block flying machine, finally explained

    Rebuild the best item from “One block, five uses” as a single survival-friendly build.

  3. Trial chamber spawners: how they really pick mobs

    Open on a spawner choosing its mob, then the one rule that decides it, published Thursday 16:00 UTC.

Apply it to your next video

“Apply this analysis to my next video” hands the verdict, the bottleneck, the opportunity and the insights to Viducia AI. The script has to report how it used each insight, or the draft is sent back.

The price, before it runs

Analytics audit: 25 tokens. If the audit fails, the tokens come back automatically. Every task price

What public data cannot show

Honest numbers: nothing ViduciaStudio cannot see is estimated or invented. Hidden like counts are shown as unknown, never as zero.

Retention, watch time, click-through rate, impressions, traffic sources, audience demographics and revenue are visible only to the channel’s owner in YouTube Studio, so they are not shown here.

Calculated by ViduciaStudio from public YouTube data. Not official YouTube Analytics. ViduciaStudio uses YouTube API Services: see the YouTube Terms of Service and the Google Privacy Policy, and our Privacy Policy.

Questions about Analytics

Where does the analytics data come from?

From public YouTube data, read by @handle. The figures are calculated by ViduciaStudio and are not official YouTube Analytics. You never sign in to YouTube through ViduciaStudio.

About Analytics

Can Analytics show retention or watch time?

No. Retention, watch time, click-through rate, impressions, traffic sources, demographics and revenue are visible only to the channel’s owner in YouTube Studio, so they are not shown.

What does Viducia’s verdict cost?

An analytics audit uses 25 edit tokens, and you approve the price first. It names the channel’s biggest bottleneck and opportunity, quotes what commenters say, and suggests your next three videos.

How many channels can I follow?

Starter follows up to 8 YouTube handles, Creator 20 and Studio 40. Your own channels and competitors count the same way.

Read a sample channel now

The live demo on the home page reads sample channels, labelled as such, so you can try Analytics and Viducia’s verdict before you create an account.